Our Products
SAHAS Alert — Earthquake Early Warning System
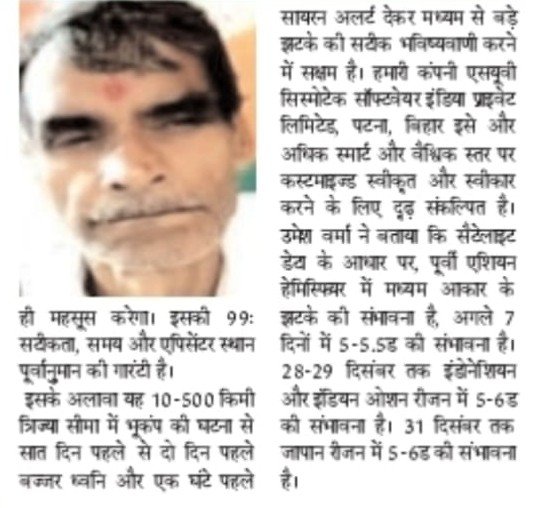
The SAHAS Alert system is proprietary software developed by SASVC SeismoTech for medium-range earthquake forecasting.
Utilizing multi-parametric analysis of satellite data, it continuously monitors the Eastern Hemisphere for pre-seismic anomalies. The system is capable of detecting warning signals, such as underground rumbling sounds, within a 10 to 500 km radius.
- Detection Timeline: 7 days to 2 days before an earthquake, with a final alert approximately 1 minute before.
- Multi-parametric Analysis: Tracks Radon, CO₂, Thermal anomalies, TEC-V, MF2, and Water table fluctuations.
IoT-Based Geophysical Monitoring Sensors
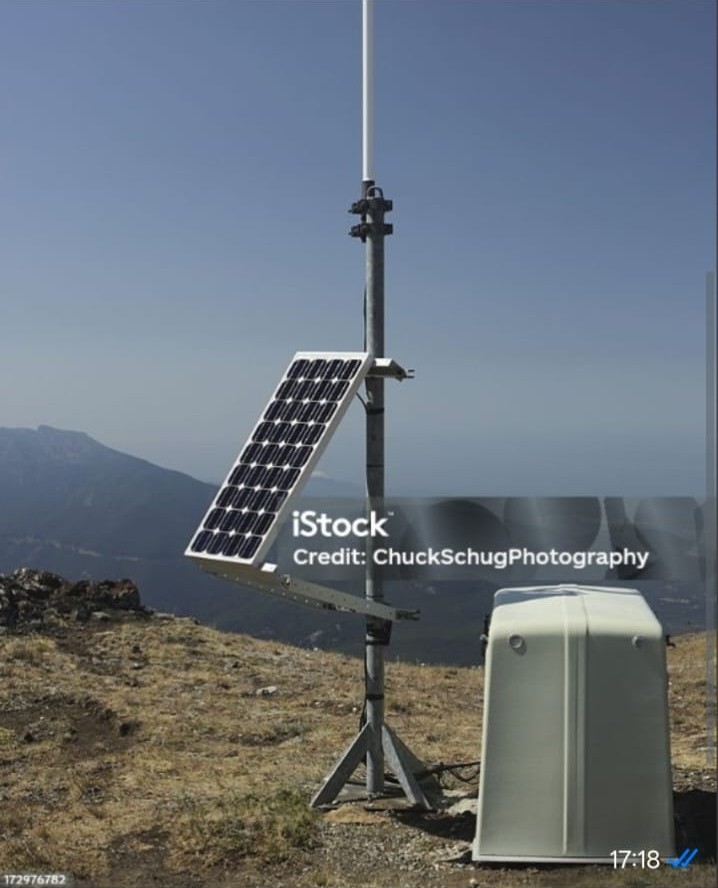
To acquire high-fidelity, real-time pre-seismic data, we deploy an array of solar-powered IoT sensors directly into active fault zones and seismic hotspots.
These robust field stations continuously monitor environmental parameters that indicate tectonic stress. The data is transmitted securely to our central servers for immediate analysis by the SAHAS Alert system.
- Continuous radon emission monitoring
- Real-time CO₂ level tracking
- Thermal anomaly detection
- Groundwater and water table fluctuation sensors
Multi-Parametric Monitoring Dashboard
Real-time visualization of seismic data across global fault lines.
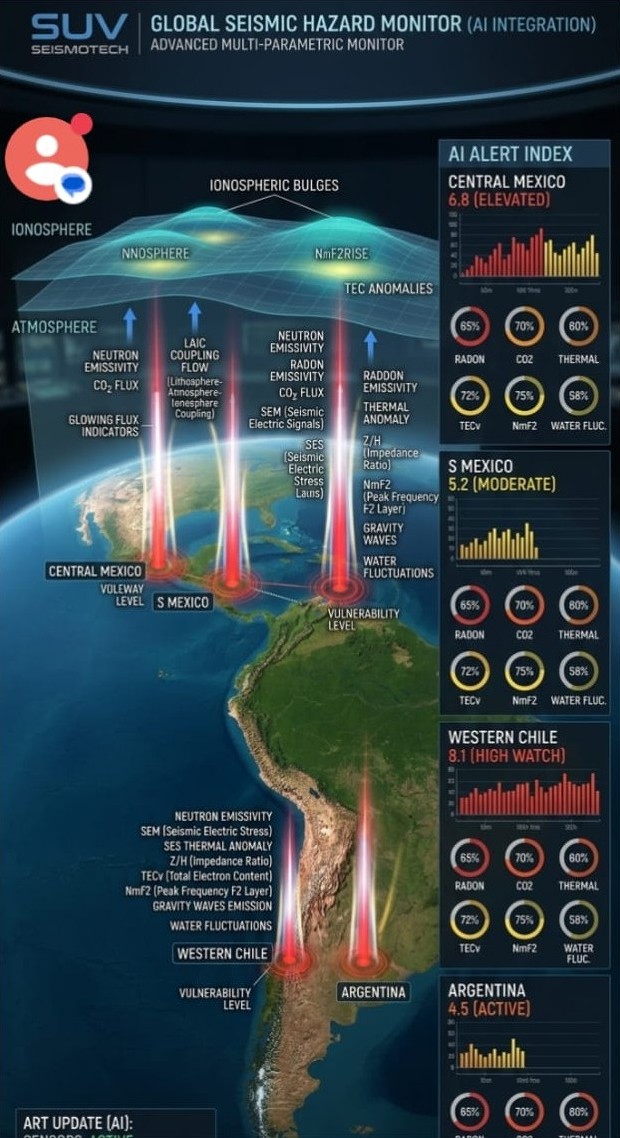
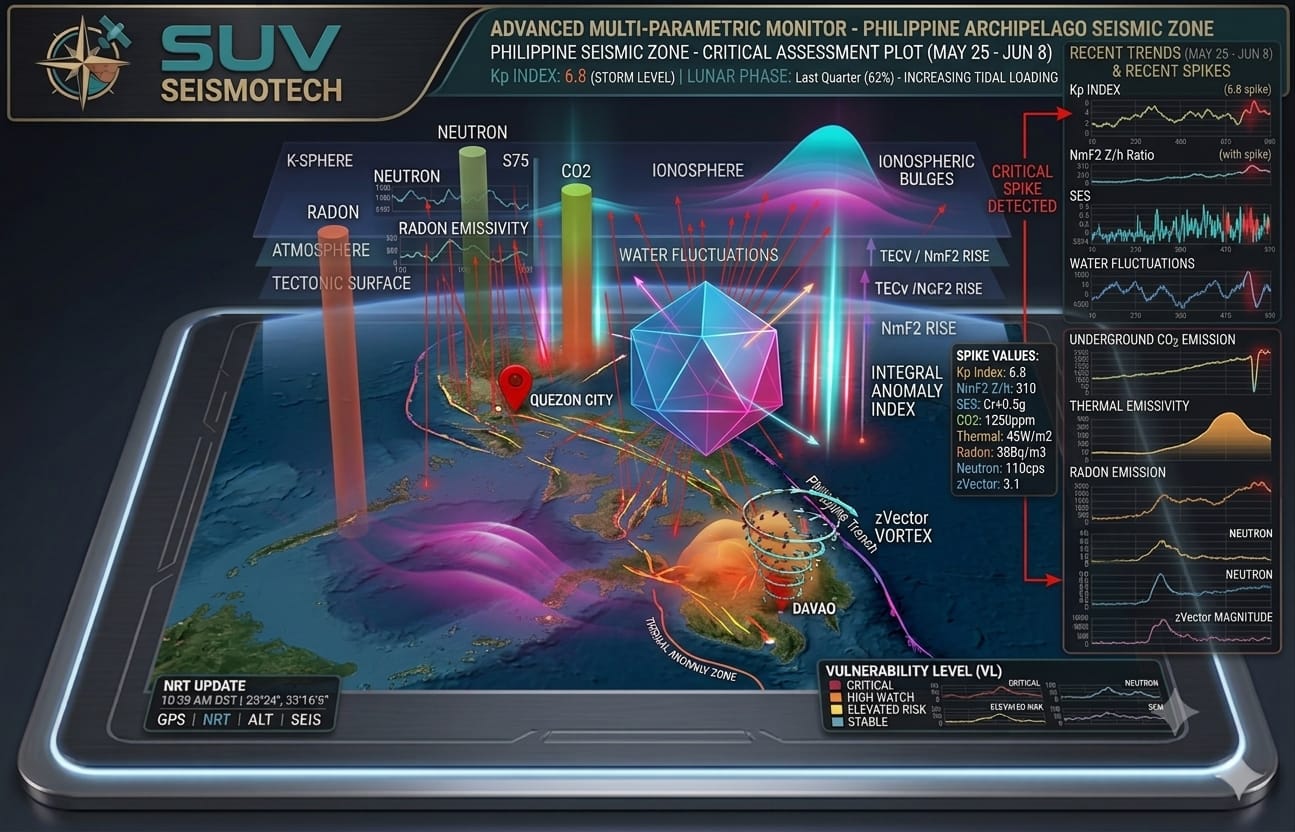
Our dashboard provides granular visibility into earthquake monitoring data for critical locations including Central Mexico, South Mexico, Western Chile, Argentina, and the Philippine Archipelago. It highlights tracked parameters such as Radon, CO₂, Thermal, TEC-V, MF2, and Water table fluctuations.
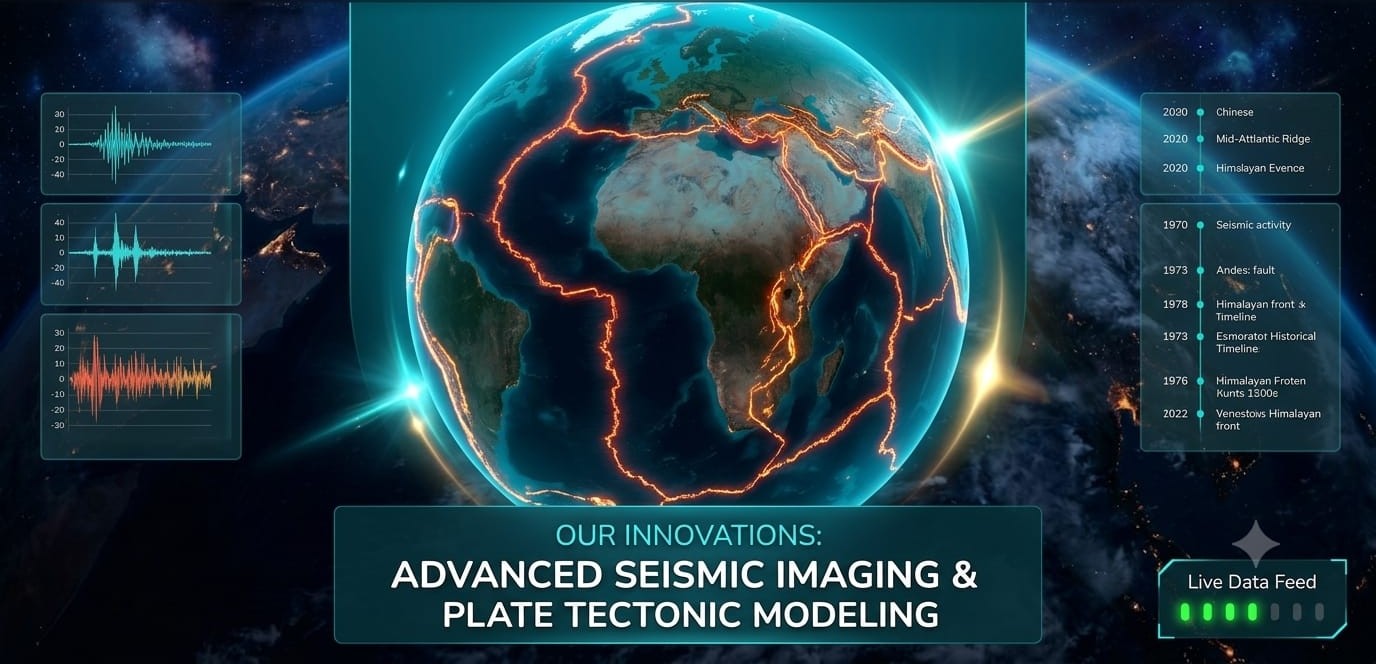
Advanced Seismic Imaging & Plate Tectonic Modeling
Visualizing the invisible forces beneath the Earth's crust is critical to our predictive models. Our software generates advanced seismic imaging based on historical earthquake data, active fault lines, and seismic frequency waveforms.
This holistic visualization approach allows our researchers to identify stress accumulation points and forecast where the crust is most likely to fracture next.